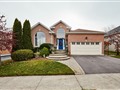
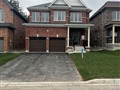
96 Calwell Dr
$821,217
Comparative Market Analysis
Jul 9, 2025
NOT AN ACTIVE LISTING
Historical Performance
| Period | $ Change | % Change |
| 1 Day | +$279 | +0.034% |
| 7 Days | +$340 | +0.041% |
| 30 Days | -$973 | -0.118% |
| 3 Months | -$1,635 | -0.199% |
| 6 Months | +$14.4k | +1.78% |
| 1 Year | -$34.8k | -4.07% |
| 3 Years | +$148k | +22.0% |
| 5 Years | +$266k | +47.9% |
| 10 Years | +$492k | +149% |
List My Property
Real Estate Statistics
Financing Solutions
AS SEEN ON


Are You a Licensed Real Estate Agent or Broker?