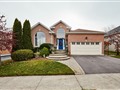
64 John St
$820,736
Comparative Market Analysis
Jul 9, 2025
NOT AN ACTIVE LISTING
Historical Performance
| Period | $ Change | % Change |
| 1 Day | +$279 | +0.034% |
| 7 Days | +$410 | +0.050% |
| 30 Days | -$626 | -0.076% |
| 3 Months | -$466 | -0.057% |
| 6 Months | +$16.9k | +2.11% |
| 1 Year | -$28.4k | -3.34% |
| 3 Years | +$173k | +26.6% |
| 5 Years | +$301k | +57.8% |
| 10 Years | +$526k | +179% |
List My Property
Real Estate Statistics
Financing Solutions
AS SEEN ON


Are You a Licensed Real Estate Agent or Broker?