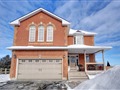
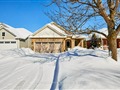
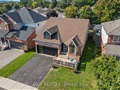
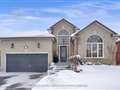
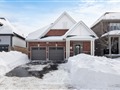
63 Anders Dr
$908,535
Comparative Market Analysis
Jul 9, 2025
NOT AN ACTIVE LISTING
Historical Performance
| Period | $ Change | % Change |
| 1 Day | +$309 | +0.034% |
| 7 Days | +$265 | +0.029% |
| 30 Days | -$1,626 | -0.179% |
| 3 Months | -$3,606 | -0.395% |
| 6 Months | +$12.2k | +1.36% |
| 1 Year | -$47.3k | -4.95% |
| 3 Years | +$134k | +17.3% |
| 5 Years | +$243k | +36.4% |
| 10 Years | +$488k | +116% |
List My Property
Real Estate Statistics
Financing Solutions
AS SEEN ON


Are You a Licensed Real Estate Agent or Broker?