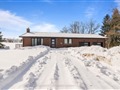
55 Cedar Grove Dr
$1,131,546
Comparative Market Analysis
Jul 6, 2025
NOT AN ACTIVE LISTING
Historical Performance
| Period | $ Change | % Change |
| 1 Day | +$377 | +0.033% |
| 7 Days | +$303 | +0.027% |
| 30 Days | -$2,077 | -0.183% |
| 3 Months | -$4,527 | -0.398% |
| 6 Months | +$15.2k | +1.36% |
| 1 Year | -$59.0k | -4.96% |
| 3 Years | +$195k | +20.8% |
| 5 Years | +$322k | +39.8% |
| 10 Years | +$870k | +333% |
List My Property
Real Estate Statistics
Financing Solutions
AS SEEN ON


Are You a Licensed Real Estate Agent or Broker?