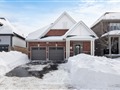
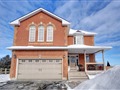
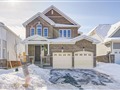
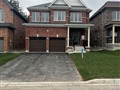
43 Anders Dr
$813,062
Comparative Market Analysis
Jul 9, 2025
NOT AN ACTIVE LISTING
Historical Performance
| Period | $ Change | % Change |
| 1 Day | +$276 | +0.034% |
| 7 Days | +$282 | +0.035% |
| 30 Days | -$1,231 | -0.151% |
| 3 Months | -$2,465 | -0.302% |
| 6 Months | +$12.6k | +1.57% |
| 1 Year | -$38.1k | -4.47% |
| 3 Years | +$135k | +19.9% |
| 5 Years | +$234k | +40.4% |
| 10 Years | +$448k | +123% |
List My Property
Real Estate Statistics
Financing Solutions
AS SEEN ON


Are You a Licensed Real Estate Agent or Broker?