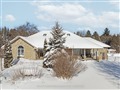
37 Nonquon Dr
$1,060,039
Comparative Market Analysis
Jul 9, 2025
NOT AN ACTIVE LISTING
Historical Performance
| Period | $ Change | % Change |
| 1 Day | +$353 | +0.033% |
| 7 Days | +$477 | +0.045% |
| 30 Days | -$1,002 | -0.094% |
| 3 Months | -$1,183 | -0.112% |
| 6 Months | +$20.5k | +1.98% |
| 1 Year | -$40.8k | -3.71% |
| 3 Years | +$228k | +27.4% |
| 5 Years | +$381k | +56.2% |
| 10 Years | +$701k | +195% |
List My Property
Real Estate Statistics
Financing Solutions
AS SEEN ON


Are You a Licensed Real Estate Agent or Broker?