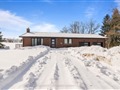
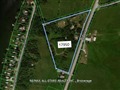
37 Cedar Grove Dr
$649,084
Comparative Market Analysis
Jul 6, 2025
NOT AN ACTIVE LISTING
Historical Performance
| Period | $ Change | % Change |
| 1 Day | +$216 | +0.033% |
| 7 Days | +$252 | +0.039% |
| 30 Days | -$810 | -0.125% |
| 3 Months | -$1,365 | -0.210% |
| 6 Months | +$11.2k | +1.76% |
| 1 Year | -$28.1k | -4.15% |
| 3 Years | +$129k | +24.9% |
| 5 Years | +$215k | +49.6% |
| 10 Years | +$408k | +169% |
List My Property
Real Estate Statistics
Financing Solutions
AS SEEN ON


Are You a Licensed Real Estate Agent or Broker?