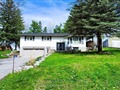
33 Riverview Dr
$1,172,565
Comparative Market Analysis
Jul 3, 2025
NOT AN ACTIVE LISTING
Historical Performance
| Period | $ Change | % Change |
| 1 Day | +$399 | +0.034% |
| 7 Days | +$682 | +0.058% |
| 30 Days | -$422 | -0.036% |
| 3 Months | +$836 | +0.071% |
| 6 Months | +$27.2k | +2.38% |
| 1 Year | -$33.9k | -2.81% |
| 3 Years | +$267k | +29.4% |
| 5 Years | +$473k | +67.6% |
| 10 Years | +$767k | +189% |
List My Property
Real Estate Statistics
Financing Solutions
AS SEEN ON


Are You a Licensed Real Estate Agent or Broker?