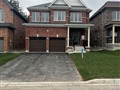
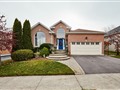
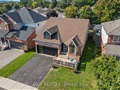
16 Winchurch Dr
$678,156
Comparative Market Analysis
Jun 30, 2025
NOT AN ACTIVE LISTING
Historical Performance
| Period | $ Change | % Change |
| 1 Day | +$231 | +0.034% |
| 7 Days | +$225 | +0.033% |
| 30 Days | -$1,079 | -0.159% |
| 3 Months | -$2,254 | -0.331% |
| 6 Months | +$9,990 | +1.50% |
| 1 Year | -$33.3k | -4.67% |
| 3 Years | +$107k | +18.7% |
| 5 Years | +$193k | +39.8% |
| 10 Years | +$381k | +128% |
List My Property
Real Estate Statistics
Financing Solutions
AS SEEN ON


Are You a Licensed Real Estate Agent or Broker?