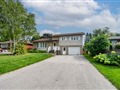
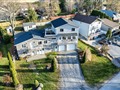
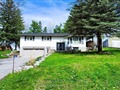
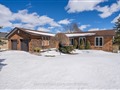
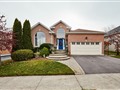
120 Cedar Grove Dr
$709,708
Comparative Market Analysis
Jul 7, 2025
NOT AN ACTIVE LISTING
Historical Performance
| Period | $ Change | % Change |
| 1 Day | +$241 | +0.034% |
| 7 Days | +$777 | +0.110% |
| 30 Days | +$1,630 | +0.230% |
| 3 Months | +$7,536 | +1.07% |
| 6 Months | +$33.7k | +4.99% |
| 1 Year | +$29.1k | +4.28% |
| 3 Years | +$251k | +54.6% |
| 5 Years | +$315k | +79.8% |
| 10 Years | +$461k | +185% |
List My Property
Real Estate Statistics
Financing Solutions
AS SEEN ON


Are You a Licensed Real Estate Agent or Broker?