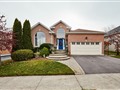
12 John St
$653,661
Comparative Market Analysis
Jul 9, 2025
NOT AN ACTIVE LISTING
Historical Performance
| Period | $ Change | % Change |
| 1 Day | +$222 | +0.034% |
| 7 Days | +$288 | +0.044% |
| 30 Days | -$692 | -0.106% |
| 3 Months | -$1,030 | -0.157% |
| 6 Months | +$12.0k | +1.88% |
| 1 Year | -$26.3k | -3.87% |
| 3 Years | +$123k | +23.2% |
| 5 Years | +$220k | +50.7% |
| 10 Years | +$414k | +173% |
List My Property
Real Estate Statistics
Financing Solutions
AS SEEN ON


Are You a Licensed Real Estate Agent or Broker?